Ethics and Best Practices for Mapping Archaeological Sites
Cecilia Smith
Texas A&M University
Abstract
Principle 6 of the Society of American Archaeology’s Principles of Archaeological Ethics emphasizes archaeologists’ responsibility to publically report archaeological investigations with the stipulation that “An interest in preserving and protecting in situ archaeological sites must be taken in to account when publishing and distributing information about their nature and location.” This paper first provides a critical review of current geolocation sharing recommendations and practices, and then describes available methods for dealing with sensitive location data and suggested best practices. Particular attention is paid to geomasking techniques, which communicate observed spatial relationships while obscuring sensitive geographic coordinates. Currently, only two geomasking techniques are widely used in archaeology: aggregating archaeological site locations into grids or administrative units, or placing points that represent site locations at a particular distance from their true locations. These techniques, while useful, are part of a larger and growing suite of tools that visually convey spatial data without revealing sensitive site locations. Principle 6 allows researchers flexibility in tailoring methods of communicating site locations, which is useful given the range of archaeological contexts. However, this work encourages researchers to responsibly exercise that flexibility by incorporating archaeological and environmental data into an explicit decision-making process for representing those places.
Current Location-Sharing Practices and Standards
Archaeologists produce data – lots of it (Bail 2014, Cooper and Green 2016, Meier 2015). It is increasingly digital, complex, and geospatial (Gupta and Devillers 2017). Government, institutional, and discipline-specific committees recommend standards for data collection, maintenance, sharing, and archiving. Legislative bodies impose regulations in these categories. Archeologists are also increasingly being held responsible for their data management through federal funding requirements and legal responsibilities. On the whole, the movement for responsible data management is beneficial to the longevity of the information created by largely destructive field techniques. This paper contributes to that work by discussing the available methods for obscuring archaeological site locations when mapping, the efficacy of those methods, suggested considerations when deciding on visualization method, and a recommendation for archaeologists to be mindful and explicit when selecting visualization methods.
Along with regulating data management, the push for open access (OA) to scholarship is also securing a foothold in the field (Huggett 2012, Costa et al. 2013, Strupler and Wilkinson 2017). True open access refers to information that is available without restriction on the internet. Evidence of OA in archaeology comes from the rise of journals such as the Journal of Open Archaeology Data, repositories such as the Digital Index of North American Archaeology (DINNA) and the Digital Archaeological Record (tDAR) which provide data with some locational restrictions, and interest groups like the Society for American Archaeology’s Open Science in Archaeology.
A balance must be struck in meeting the security and legal needs of sensitive archaeological information while effectively communicating spatial patterns. If site security was a concern, this balance has largely been struck by archaeologists in two ways: mapping sites at low resolution or aggregating sites to grids or administrative boundaries. Often, visualizations of site locations are not accompanied by an explicit description of security concerns. A recent, and well executed, example of low resolution mapping comes from Bethke (2017: 801). While the Bethke does not indicate if the map’s scale was chosen in part to obscure, its ratio scale (somewhere in the range of 1:6,500,000) appears sufficiently vague to obscure the actual location from viewers. The map clearly indicates the project’s area of interest and depicts the spatial patterning of archaeological sites according to their chronology. This paper calls on findings from the field of public health to explore the degree to which methods, such as using low resolution maps, obscure actual site locations.
DINNA, a repository for North American archaeological data, does not share actual site locations with the public, but aggregates site counts. Their website indicates that the data are “publically viewable as KML data with two types of representation, at the level of US county and in a ~20km grid” (Anderson et al. 2011). The grid size was chosen as previous work provided precedent (DINNA 2013). DINAA’s explicit discussion of data resolution for the purposes of obscuring data is relatively rare, and emphasizes protection of the data, going so far as to not store precise locational data at all. Large-scale trends are visible via the grid representation at the sacrifice of more localized spatial patterning. This paper explores how other methods may help communicate small scale spatial patterning while continuing to protect locational data.
There are existing legislation and recommendations in regards to the sharing of archaeological site locations, although, in many contexts there is a great deal of autonomy in how to visually represent sites and no available archaeological literature on available techniques for obscuring sites while still communicating archaeological findings. Section 304 of the National Historic Preservation Act (NHPA ) states that information should be withheld from the public if “disclosure could result in a significant invasion of privacy, damage to the historic property, or impede the use of a traditional religious site by practitioners” (http://www.achp.gov/304guidance.html). This includes “street addresses, highway and route numbers, Universal Transverse Mercator (UTM) or Geographic Information System (GIS) coordinates, electronic maps, and descriptions, including photographs and drawings, of the property's position in relation to local landmarks or natural features such that it could be found.” The Advisory Council on Historic Preservation also indicates that “If information is already in the public realm but with very limited accessibility, it does not mean that it can no longer be protected from further disclosure.” This restriction applies only to properties that are listed in the National Register of Historic Places as determined by the Keeper of the National Register.
Section 9 of the Archaeological Resources Protection Act (ARPA) also prohibits public disclosure of information concerning the nature and location of archeological resources that require a permit or other permission under ARPA for their excavation or removal. Beyond the designation of sensitive data via Section 304 of the NHPA or Section 9 of the ARPA, are many potentially at-risk sites and the wide range of standards employed internationally. These sites are covered by the SAA’s Principle 6 which encourages “taking into account” preservation and protecting sites when disclosing site locations. This paper discusses methods for mapping archaeological sites that take into account these concerns.
Vulnerability of Location-Sharing Practices
Geographic information systems (GIS) is a powerful tool for collecting, managing, analyzing, and visualizing spatial information. The precision and accuracy of GIS products depend on researchers’ decision making and the equipment used. As introduced above, archaeologists must balance the security of an archaeological site according to its importance and vulnerability, while meeting expectations for responsible, open science. This paper does not provide techniques to assess a site’s sensitivity, but explores the available options for obscuring site locations and how those options balance security and scholarship.
A number of recent public health publications exposed security flaws in common location-obscuring practices in visualizing spatial data. In 2006 Brownstein, Cass, and Mandl published a correspondence piece in the New England Journal of Medicine in which they called for guidelines in representing patients’ homes to preserve anonymity. They suggest that the common practice of using lower resolution maps was less effective than aggregating patients to administrative units (e.g. census tracts), or their preferred method of randomly changing a patient’s location within a fixed distance. Over the next decade public health specialists have conducted reverse geocoding experiments to test geomasking methods (Brownstein et al. 2006, Boulos et al. 2009, Allshouse et al. 2010, Hampton et al. 2010, Zandbergen 2014, Seidl et al. 2017). The process of finding an address from a coordinate pair is referred to as reverse geocoding. Geomasking is a process of obscuring the location of real world coordinates. After geomasking a set of coordinates, researchers found the probability that a patient’s true location could be identified from available patient data, distance between the observed and offset coordinates, and population density of the area. Their work reveals a number of geomasking techniques which balance security and open science (sharing unobscured location data) in different ways.
Instead of patient anonymity, archaeologists concerned about site security should consider how difficult it would be to identify a site from a geomasked map and how rigorous an attempt should be made to obscure sites versus sharing spatial patterning information. Only two geomasking techniques are routinely employed by archaeologists, with only one or two others having rare representations in the literature. The following section describes geomasking methods that can be applied to archaeological sites. Each balances security and open data differently.
Methods for Visualizing Sensitive Location Data
Aggregation shows the number of sites within a given boundary. The most common boundaries being administrative units (e.g counties) and grids. When purposefully and explicitly obscuring archaeological sites, this is the most common method employed. This method can show large scale distribution, but does not allow for spatial patterning at the micro-region or local levels.
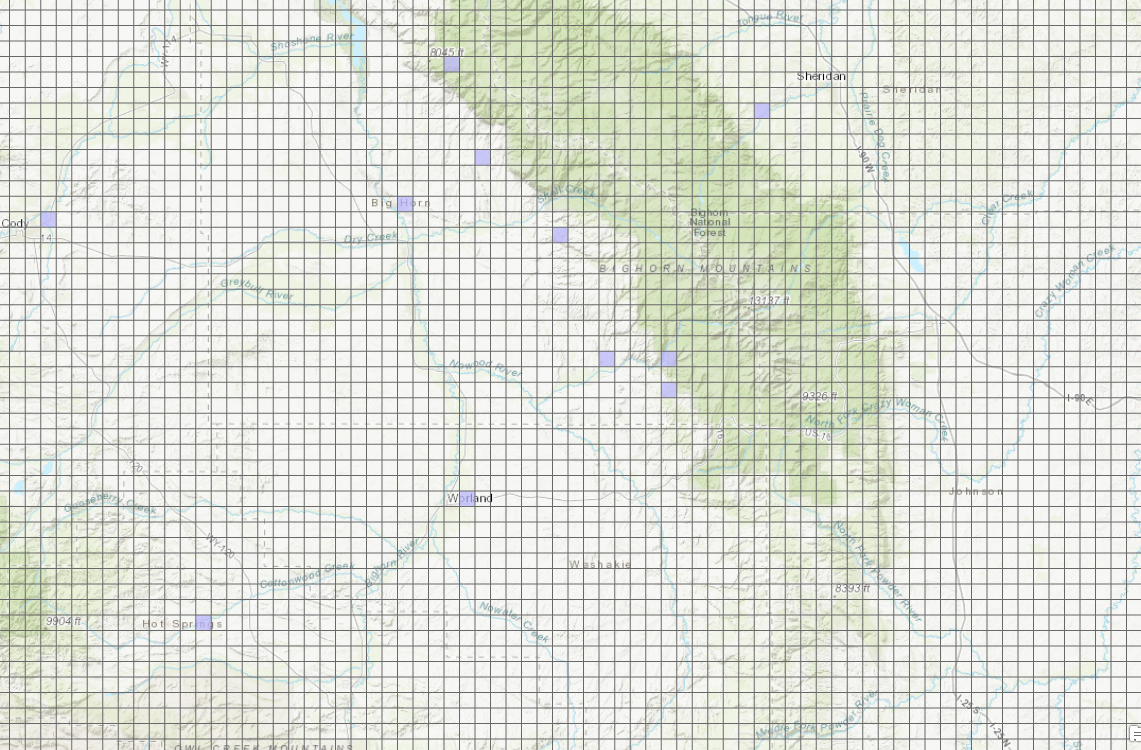
Figure 1. Archaeological sites aggregated by 20 km2 grid cells. In this case, purple cells represent the presence of one site. The scale is 1: 1,000,000.
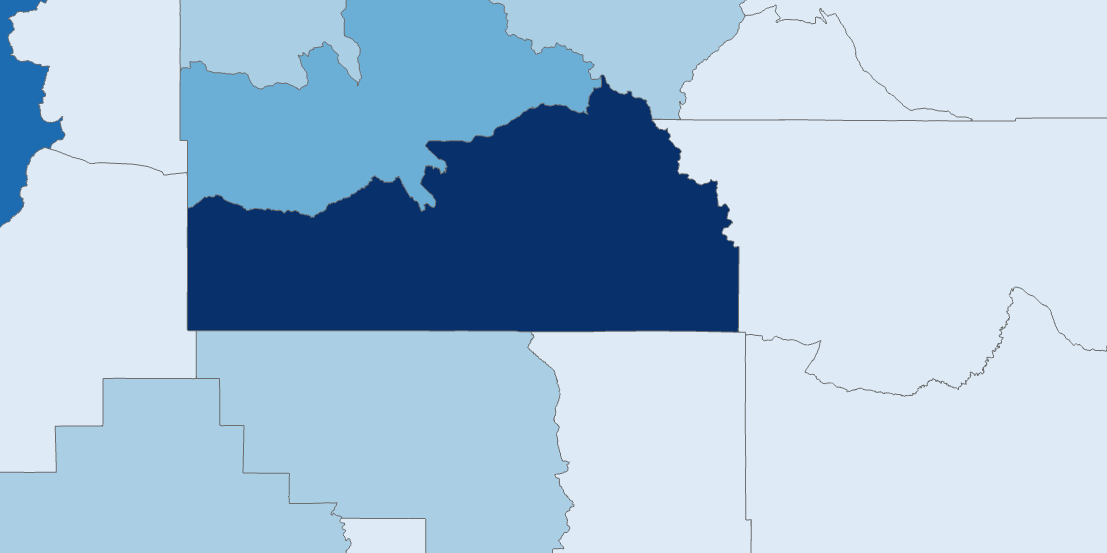
Figure 2. The same area as above, with sites aggregated to county boundaries. Darker color represents more sites. The scale is 1: 1,000,000.
Low Resolution Maps indicate the actual observed location with the assumption that the low resolution (e.g a scale of 1:5,000,000) will make it difficult to find the real world location.
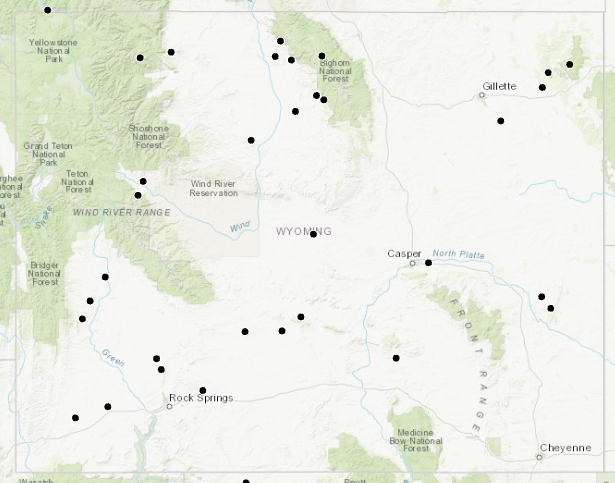
Figure 3. Archaeological sites mapped at the low resolution of 1:5,000,000
Heat Maps are representations of the density of observations, for example the density of archaeological sites. Densities are calculated using a neighborhood, or kernal, the size of which is defined by the user.
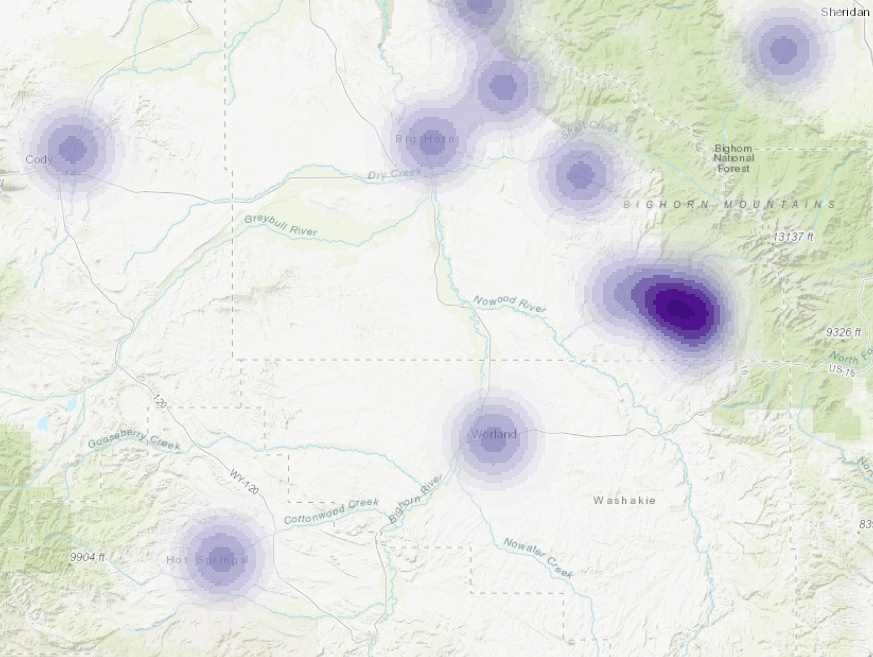
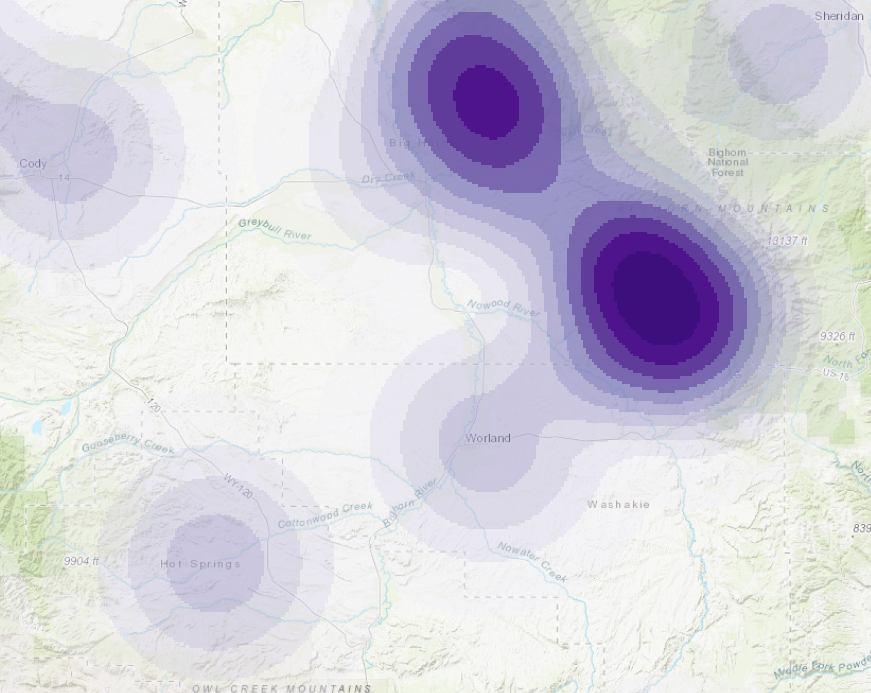
Figure 4. Archaeological sites depicted by heat maps. Above, is a kernal size of 20km, below is a kernal size of 50km. The scale is 1: 1,000,000.
Bounding Boxes are hollow squares surrounding all the observations of a given area, but do not depict the site locations.
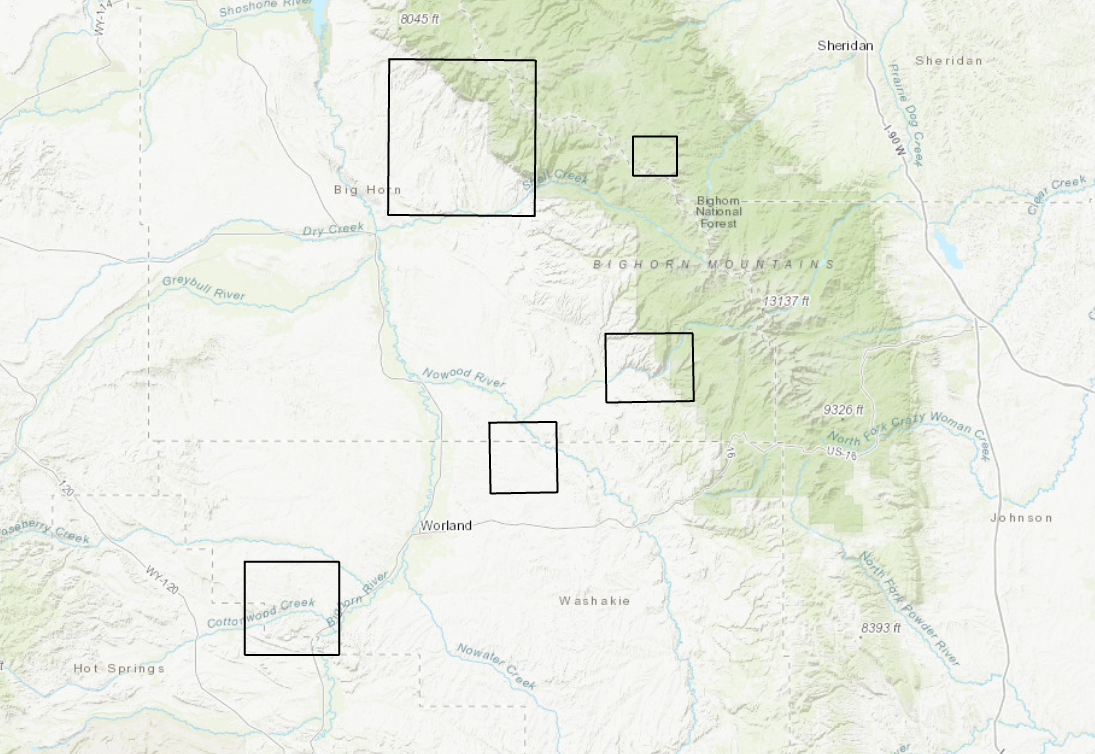
Figure 5. Bounding boxes drawn around individual and clusters of sites. The scale is 1: 1,000,000.
Coordinate Patterns without Basemaps are used to accurately convey the spatial relationships of observations, but without the context of a topographic or administrative maps.
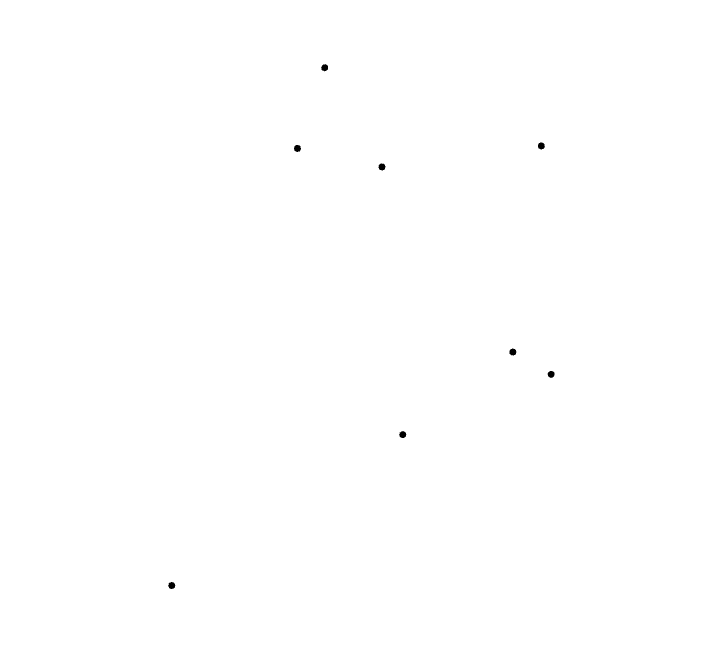
Figure 6. Locations of archaeological sites with the topographic basemap removed.
Random Direction with a Fixed Radius allows the user to define a particular distance from which the geomasked point is shown away from the observed coordinate. The direction in which the geomasked point is placed is randomly selected via algorithm.
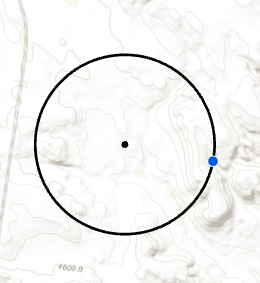
Figure 7. The geomasked point (blue) is placed in a random direction 1 km away from the observed point (black). The black ring represents possible locations for a geomasked point.
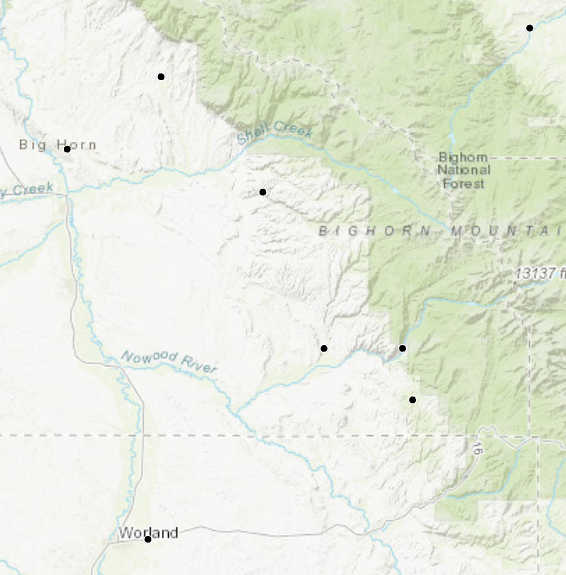
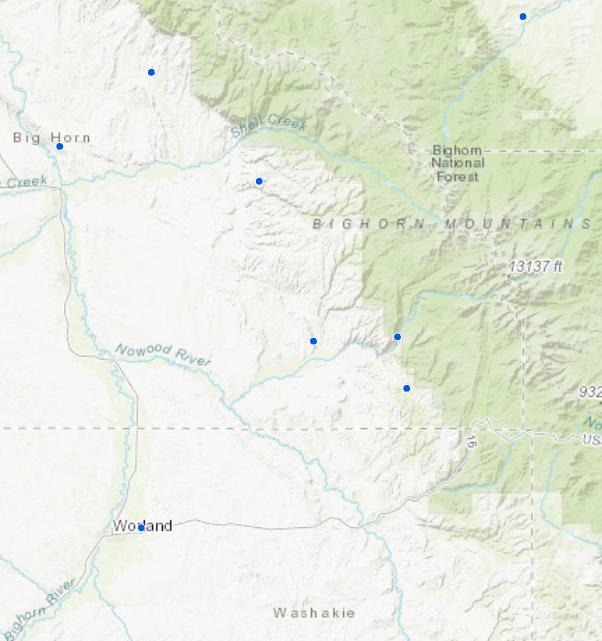
Figure 8. On the left are observed points, and on the right are geomasked points moved 1km in a random direction. The scale is 1: 1,000,000.
Random Perturbation within a Fixed Radius allows a maximum distance from which a geomasked point may be offset from an observed point. The geomasked point will be placed in a random direction away from observed point, and at a random distance within the maximum distance specified by the user.
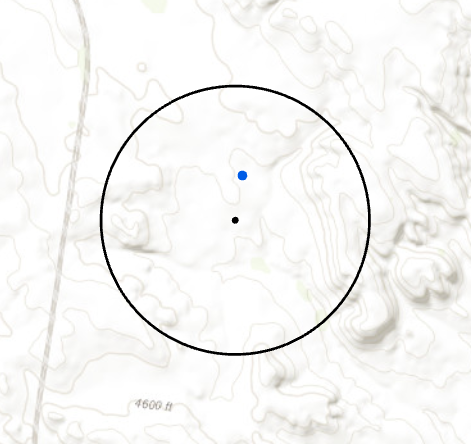
Figure 9. The geomasked point (blue) is placed in a random direction in a random distance within 1 km of the observed point (black). The black ring represents the boundary of the area in which a geomasked point could be placed.
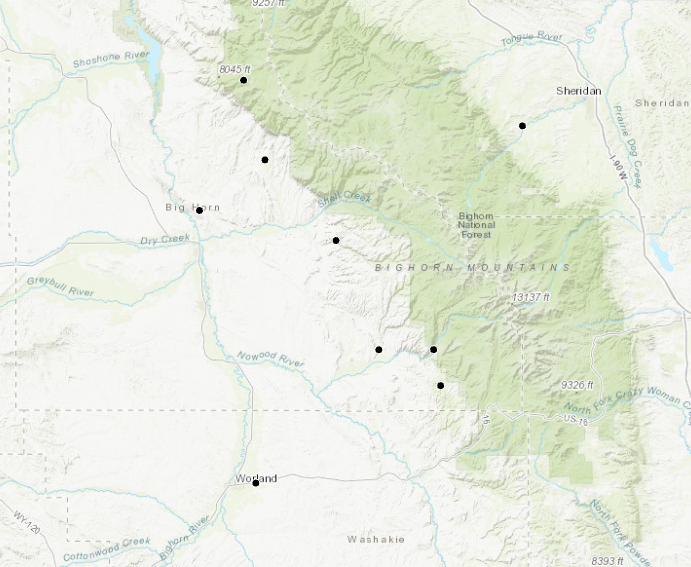
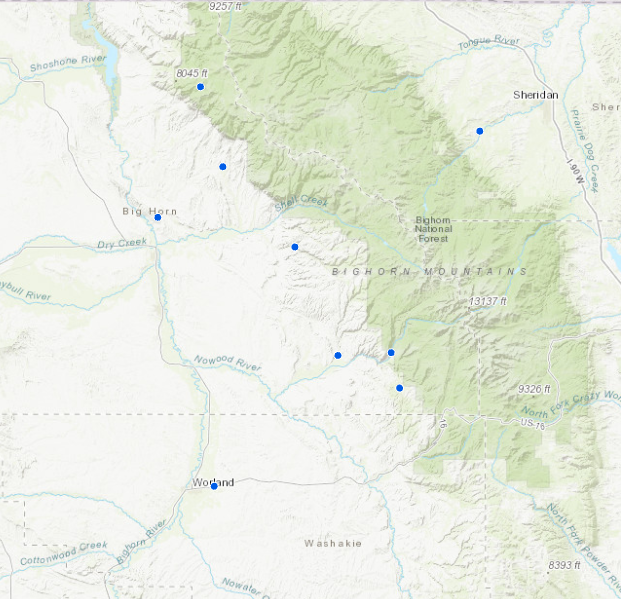
Figure 10. On the left are observed points, and on the right are geomasked points moved in a random direction and to a random distance within 1km of the observed point. The scale is 1: 1,000,000.
Gaussian Displacement resembles Random Perturbation within a Fixed Radius, with the exception that geomasked points are distributed in a normal distribution away from the observed point with the maximum distance being set by a contextual variable. For example, in public health, the greater the population density (the contextual variable) the smaller the maximum distance from an observed point.
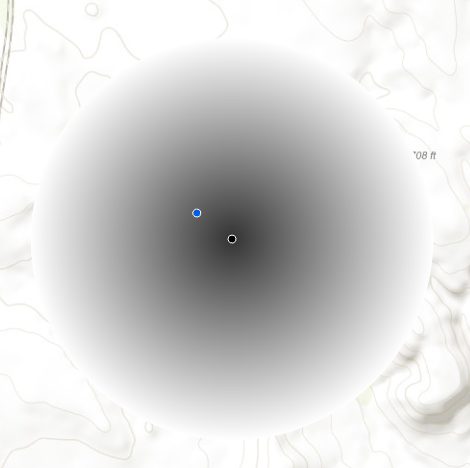
Figure 11. A geomasked point (blue) is placed way from the observed point (black) at a distance determined by at least one contextual variable, such as density of sites.
Donuts are similar to Random Perturbation within a Fixed Radius, but also include a minimum distance from which the geomasked points must be placed from the observed points. Overall, the donut method is generally the most effective at masking locations in public health studies while still providing visualization of spatial patterning.
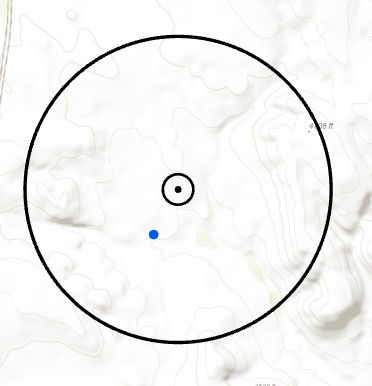
Figure 12. The geomasked point (blue) is placed in a random direction and at a random distance between a minimum distance (inner circle) and maximum distance (outer circle) from the observed point (black). The example above shows a minimum distance of 100 m and a maximum distance of 1 km.
Gaussian Donuts, also referred to as Bimodal Gaussian Displacement, are similar to Gaussian Displacement but also set a minimum threshold from which the geomasked points can be placed from the observed points. Gaussian donuts are also very effective in masking true locations while showing spatial patterning, the added dimension of adjusting the maximum displacement range allows for smaller offsets in densely populated areas.
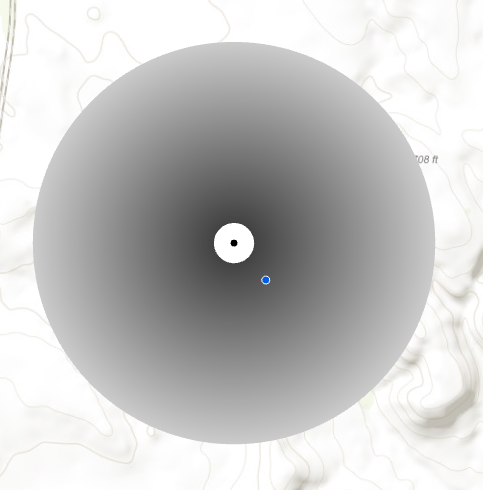
Figure 13. The geomasked point (blue) is placed in a random direction and at a random distance between a minimum distance (inner circle) and maximum distance (outer circle) from the observed point (black). The maximum distance is created by using the distribution of a variable, such as density of sites. The example above shows a minimum distance of 100 m and a maximum distance of 1 km.
Programming Models, such as linear programming and digit switching, involve using code to systematically obscure real world coordinates. Linear programming considers each observation and applies a models that include probability of successful reverse geocoding, constraints, and objectives. Digit switching changes two or more digits of coordinates in the Military Grid Reference System (MGRS). Another code is used as a key to replace the original digits. By specifying the digits to be switched, the user had control over the maximum distances to which coordinates will be geomasked. Illustrations of linear programming can be found in Wieland et al. 2008. Illustrations of digit switching can be found in Clarke 2016.
Voronoi or Thiessen Method identifies the center of polygonal areas, usually land parcels in public health studies, and creates Voronoi, also known as Thiessen, polygons. Voronoi polygons are the result of lines drawn through the midpoints between observed points. Geomasked points for each observation are placed on the closest part of the closest Voronoi edge. For parcel data, this method generally avoids placing a geomask point near a polygon centroid. Illustrations of this method can be found in Croft et al. 2016.
Scholarship and security are balanced differently in each of these approaches. Future work will quantify those differences within different archaeological contexts. For now, there are some generalities that can be made based on findings in public health and the nature of the individual methods. First, skewed heavily in the direction of security are aggregation, heat maps, and bounding boxes. These techniques make it improbable that the actual sites will be identified, at the cost of entirely obscuring spatial patterning for other archaeologists and the public. Also skewed heavily in favor of security are observed site locations published without a basemap. Without topographical clues, identifying the actual sites would be very difficult. However, there is the risk that once one site is identified the other site locations could be identified using the published spatial relationships. Lack of a basemap also prevents the viewer from drawing independent conclusions from contextual information provided by surrounding topography.
Versions of donut masking take a more calculated risk between scholarship and security. By placing a geomasked point at some distance, usually a relatively small distance, from an observed point, researchers tighten the potential search area to locate an at-risk site. However, experiments in public health show that the risk of reverse geocoding (identifying the observed location) is much smaller with donut methods than with low resolution mapping – the most commonly deployed technique in archaeology, and prior to the last decade, the most commonly deployed in public health. A comparison of low resolution and donut geomasking was conducted on 50 archaeological sites in Wyoming. Static maps of observed site locations were produced at the scales of 1: 100,000; 1: 5,000,000; and 1: 20,000,000. These maps were brought into ArcGIS, georeferenced, and then digital points placed on the observed points. The distances between the actual points and the points placed after digitizing were recorded. Geomasked points were also created using the donut method in which the maximum distance was set at 1 km and the minimum distance was set at 250 m. A summary of the results is presented in Table 1. Perhaps most surprising was that even at the commonly used low-resolution of 1: 5,000,000, some of the geomasked points were quite close to the actual points. An initial interpretation is that to err on the side of security, donut masking or scales over 1: 5,000,000 are preferable.
| 1: 100,000 | 1: 5,000,000 | 1: 2,000,0000 | Donut |
|---|---|---|---|
| Mean 23.09 | Mean 602.11 | Mean 3546.43 | Mean 688.08 |
| Median 21.03 | Median 564.83 | Median 3523.52 | Median 718.91 |
| St. Deviation 12.28 | St. Deviation 272.78 | St. Deviation 1470.57 | St. Deviation 214.52 |
| Minimum 4.79 | Minimum 51.40 | Minimum 285.33 | Minimum 251.79 |
| Maximum 48.40 | Maximum 1468.25 | Maximum 7943.30 | Maximum 992.00 |
Table 1. A summary of the distances in meters between an observed point and the geomasked point. Notice the relatively low minimum distanced for 1: 100,000 and 1: 5,000,000.
Donut masking, some programming models, and voronoi methods have been explored for how well they maintain spatial relationships. Public health researchers indicate that each of these three methods can be used to retain clustering observed in real world locations. Donut masking can easily be implemented in archaeology with existing GIS software. Voronoi methods require an underlying polygon layer from which to create centroids, which is more conducive to studying modern residential associations than archaeological sites. Programming methods may be tailored to archaeology, but no work has been complete in this area. Digit switching in particular does not retain spatial patterning well (Seidl et al 2017). Next steps in this work will involve a quantitative study of the each of these methods and their potential for application in archaeology.
Next Steps: Explicit Decision Making and Best Practices
Current standards do not include best practices for how to visualize sensitive archaeological sites. Because it is important for archaeologists to share their work widely, knowledge of the available methods for obscuring sensitive geographical data should be available. This paper is an introduction to primary geomasking techniques. The next step will be to assess each of these methods for use in archaeological applications, identifying the degree to which they obscure sites, displace geomasked points, and the degree to which spatial patterning is still discernable.
Archaeologists should maintain autonomy in choosing a visualization method. Given the degree to which context can alter the degree of site sensitivity and how factors (e.g. site density, topography, contemporary infrastructure) influence geomasking techniques, it would be inappropriate to proscribe a one-size-fits-all geomasking approach. The methods reviewed here are intended to encourage archaeologists to be mindful of how they are represent archaeological sites, consciously choosing how they are visualized in journals, on the internet, and for the public. Being explicit in these choices, particularly when true locations are shared or when locations are heavily obscured, should be a standard in the field.
The next step in this work is to test these geomasking techniques in a range of contexts to determine a workflow that facilitates archaeologists’ visualization decision-making. Rather than a strict formula of when to use which technique, the result will be a list of factors to consider when producing maps of archaeological sites, and suggested geomasking techniques or modifications to create the level of geographic obscurity desired by the archaeologist. Examples of factors will include legal restrictions on sharing site location; importance of a sites not covered by restrictions; topography; contemporary infrastructure; standing historic or prehistoric architecture; potential to detect site remotely, and site density.
References
Allshouse, William B., Molly K. Fitch, Kristen H. Hampton, Dionne C. Gesink, Irene A. Doherty, Peter A. Leone, Marc L. Serre, and William C. Miller. "Geomasking sensitive health data and privacy protection: an evaluation using an E911 database." Geocarto international 25, no. 6 (2010): 443-452.
Anderson, David, Eric Kansa, Sarah Kansa, Stephen Yerka, and Wells. Developing the Cyberinfrastructure for a National Archaeological Site Database from DINNA’s NASD proposal http://ux.opencontext.org/wp-content/uploads/2012/09/DINAA-NASD-Technical-Proposal-2011.pdf Accessed 3/22/2018.
Bail, Christopher A. "The cultural environment: measuring culture with big data." Theory and Society 43, no. 3-4 (2014): 465-482.
Bethke, Brandi. "The Archaeology of Pastoralist Landscapes in The Northwestern Plains." American Antiquity 82, no. 4 (2017): 798-815.
Boulos, Maged N. Kamel, Andrew J. Curtis, and Philip AbdelMalik. "Musings on privacy issues in health research involving disaggregate geographic data about individuals." (2009): 46.
Brownstein, John S., Christopher A. Cassa, Isaac S. Kohane, and Kenneth D. Mandl. "An unsupervised classification method for inferring original case locations from low-resolution disease maps." International Journal of Health Geographics 5, no. 1 (2006): 56.
Clarke, Keith C. "A multiscale masking method for point geographic data." International Journal of Geographical Information Science 30, no. 2 (2016): 300-315.
Cooper, Anwen, and Chris Green. "Embracing the complexities of ‘big data’in archaeology: the case of the English Landscape and Identities project." Journal of Archaeological Method and Theory 23, no. 1 (2016): 271-304.
Costa, Stefano, Anthony Beck, A. H. Bevan, and Jessica Ogden. "Defining and advocating open data in archaeology." Amsterdam University Press, 2013.
Croft, William Lee, Wei Shi, Jörg-Rüdiger Sack, and Jean-Pierre Corriveau. "Location-based anonymization: comparison and evaluation of the Voronoi-based aggregation system." International Journal of Geographical Information Science 30, no. 11 (2016): 2253-2275.
DINAA. Sensitive Data Security Measures and SHPO Collaboration found at http://ux.opencontext.org/archaeology-site-data/dinaa-sensitive-data-security-measures-and-shpo-collaboration/ Accessed 3/22.
Gupta, Neha, and Rodolphe Devillers. "Geographic visualization in archaeology." Journal of Archaeological Method and Theory 24, no. 3 (2017): 852-885.
Hampton, Kristen H., Molly K. Fitch, William B. Allshouse, Irene A. Doherty, Dionne C. Gesink, Peter A. Leone, Marc L. Serre, and William C. Miller. "Mapping health data: improved privacy protection with donut method geomasking." American journal of epidemiology 172, no. 9 (2010): 1062-1069.
Huggett, Jeremy. "Promise and paradox: accessing open data in archaeology." In Proceedings of the Digital Humanities Congress. 2012.
Meier, Patrick. Digital humanitarians: how big data is changing the face of humanitarian response. Crc Press, 2015.
Seidl, Dara E., Piotr Jankowski, and Keith C. Clarke. "Privacy and False Identification Risk in Geomasking Techniques." Geographical Analysis. 2017.
Strupler, Néhémie, and Toby C. Wilkinson. "Reproducibility in the Field: Transparency, Version Control and Collaboration on the Project Panormos Survey." Open Archaeology 3, no. 1 (2017): 279-304.
Wieland, Shannon C., Christopher A. Cassa, Kenneth D. Mandl, and Bonnie Berger. "Revealing the spatial distribution of a disease while preserving privacy." Proceedings of the National Academy of Sciences 105, no. 46 (2008): 17608-17613.
Zandbergen, Paul A. "Ensuring confidentiality of geocoded health data: assessing geographic masking strategies for individual-level data." Advances in medicine 2014 (2014).